Direct Air Capture: a CO₂ Needle in a Haystack
Remove CO₂ from the Air, Why ?


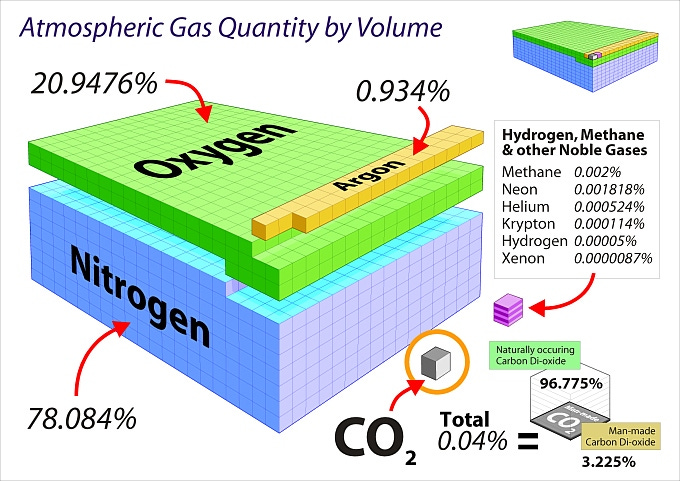
As shown, CO₂ is a trace gas in our atmosphere at about 0.04 %, or 4 molecules in 10,000 (about 420 ppm). For simplicity sake, water is excluded in the graphic above. Atmospheric water generally ranges from <0.1 % to about 4 % depending on elevation and/or proximity to the equator, and plays a dominant role in controlling earth temperatures due to clouds and the ocean.
Preface: The Negligible Effect of CO₂ on Warming
Dear Readers, Gene of GreenNuke and I tend to default to 101 concepts for problem solving and sharing information. Some things may stand out as being obvious, or common sense, but it is always prudent to double check concepts and data to prevent foot-in-mouth syndrome.
Take for example the graphic above showing the tiny fraction of CO₂ in air (0.04%). One might surmise that this tiny amount of CO₂ may not be a major contributor to global warming, especially when compared to the forces exerted by the sun, moon, earth orbit, volcanoes, tectonic shifts, or water in the ocean/land/ice caps/atmosphere.
Water in the atmosphere, which averages about 2 % (50 times more than CO₂) has a profound influence on meteorological phenomena and earth temperatures, and is a “global warming gas” in itself. Importantly, water forms clouds that cover much of earth’s surfaces, as recorded from space satellites. Cloud reflectivity of impinging sunlight (albedo) has a large effect on the Earth’s temperature, per graphic below:

Above: reflectivity of the earth’s surfaces and clouds. Average is about 30 %, but note clouds at 80 %. Since the earth is covered by clouds 67 % of the time, cloud albedo plays a major role in temperature moderation. Ice and glaciers are also powerful reflectors, but only cover about 12.5% of the earth.
Cloud albedo has a profound effect on the Earth’s temperature, and varies depending on the cloud height and diffusivity. At any one time, roughly 60 to 67 % percent of Earth’s surface may be covered by clouds, per satellite data gathered over many decades, from as far back as Apollo 8 (57 years ago). Scientists at the University of Wisconsin have also estimated cloud cover to be about 65 % using NASA data over a period between 1991 and 1995.
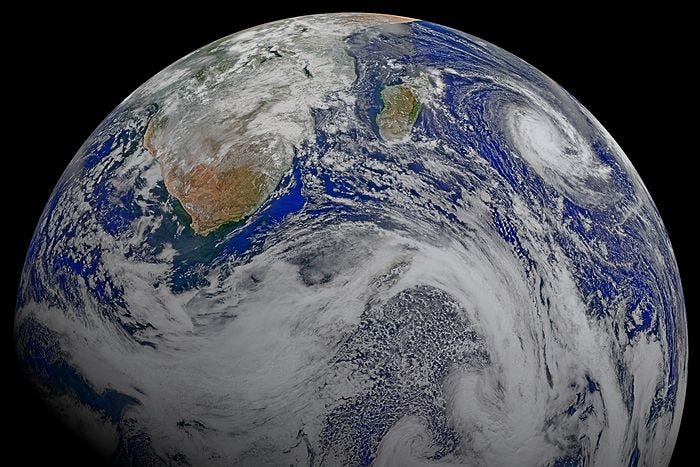
Per NASA, up to 67 percent of Earth’s surface may be covered by clouds at any one time.
An albedo review article from the peer-reviewed journal of the National Academy of Sciences (NAS) is found here: “Albedo is a simple concept that plays complicated roles in climate and astronomy”
Here we suggest that 400 ppm of CO₂ in the air cannot compete with albedo, nor the magnitude(s) greater warming and cooling forces of the sun, moon, earth orbit, volcanoes, tectonic shifts or the water in the ocean/atmosphere/land/ice caps. We note that Nobel Prize Winner John Clauser and many others have extensively discussed the negligible role of CO₂ on warming versus the much more powerful planetary forces, such as cloud albedo and even volcanic activity, which can also effect albedo.

Above: Volcanic activity also has a profound effect on global warming and cooling in a feedback-loop. For example, Philippines’s Mount Pinatubo eruption in 1991, caused a temporary 0.5°C drop in global temperatures. Many legitimate scientists think that volcanic activity over the earth’s history may have initiated a number of ice ages per ice core studies. Warming cycles can cause the melting of ice and volcanoes to blow, in another feedback loop.
Ice Ice Cold: Taking into account the aforementioned very strong planetary forces, it is also worth mentioning that the planet has been warming and cooling by itself, before humans, typically in 10,000 year cycles. Ice cores have shown unequivocally that we are now exiting a ice age or colder period per below:

Remove CO₂ from the Air: Where is the Logic and Reason ?
We are moving our way to the subject of direct air capture in this article, but without taking anything for granted, we ask our readers for one last favor, and that is to engage in the following Gedankenexperiment or “thought experiment” below.
Gedankenexperiment: have you ever looked at a set of numbers or a spreadsheet and saw a number that stood out or didn’t make sense? For example, which number stands out in the list below?
8
16
10000
20
7
It is easy to see that 10000 stands out.

Above: In another Gedankenexperiment, we like this classic Sesame Street video “One of these things is not like the others”, still available on YouTube.
The Agonizing Extrication of CO₂ from Air

Above: direct air capture (DAC) cartoon shows that dilute CO₂ is “scrubbed” or captured by a “filter”, typically a chemical absorbent such as caustic soda or NaOH. After capture, CO₂ is released from the absorbent by heating, followed by isolation, storage, maintenance, and possibly injection of the captured CO₂ into the earth.
DAC is an Extremely Inefficient Process

Above: marbles don’t orient themselves spontaneously by color, they tend towards a disordered mixture of colored marbles. The same goes for very dilute CO₂ in air.
The Second Law of Thermodynamics teaches us that things in our world tend irreversibly towards disorder, which may be interpreted as an increase in entropy. Essentially all processes are irreversible or go only in one direction.
For example: take 5 blue marbles and 5 red marbles, and separate them by color. You have to do some work to do that, and entropy decreases because you have ordered the objects, but entropy must increase somewhere else. I am betting that you have never seen a mixture of 5 blue marbles and 5 red marbles spontaneously order themselves by color, size, or shape.
One has to do work to order things in our world, and there is an energy expense for doing that, usually by burning fossil fuels, with a concomitant and irreversible increase of disorder or entropy somewhere else. We hope to do the most efficient work, but there are many inefficiencies in reality. DAC is the Poster Child for inefficiency, as we will show.
Airing it Out with Trace CO₂ Therapy
Air comprises nitrogen, oxygen, and other trace gases such as CO₂, which have a tendency to mix and disorder. This behavior is referred to as the entropy of mixing.
We note that thermal energy or heat creates disorder and imparts kinetic energy in gases. Gas and air molecules are always in motion and vibrating, except at absolute zero Kelvin.
Gas molecules do not spontaneously order themselves into neat piles or lumps, unless one does work on them such as energy intensive liquification via cooling, freezing and/or pressurization. Gas molecules prefer to stay well mixed and bounce around as illustrated in the air mixture below, with trace CO₂ in red :

Above: “normal state” of well mixed CO₂ (red) in air, bouncing around randomly with thermal energy and vibrating.

Above: red CO₂ molecules segregated from other air molecules. Work had to be done on the mixture to lower it’s entropy. That requires lots of energy.
Mr. Sherwood and Finding a CO₂ Needle in a Haystack
Most of us have an intuitive feel that one has to do a lot of work to find a needle in a haystack and isolate it. Two examples:
Mining industry: one may imagine that it is “worth it” to separate a trace amount of a valuable substance, such as 3 ppm gold (Au) from a pile of dirt and rocks. That is the basis for the mining industry and refined metals. And it takes a heck of alot of energy to isolate that gold, as Tuco can attest.
Chemical and pharmaceutical industries: one has to refine a chemical mixture to isolate a desired substance, such as a pure drug. This is what chemists do.
Separating the Dilute from the Plenty is Plenty Costly. In 1959, Thomas K. Sherwood, a legendary chemical engineer, developed the concept that the cost to separate a given substance from a mixture scales inversely with the initial concentration of that substance.

Sherwood published the original version of what is now commonly referred to as a Sherwood plot, which graphically illustrates that the cost to separate a given substance from a mixture scales inversely with the initial concentration of that substance.
This means that the more dilute the stuff is that you want, the more costly it will be to isolate it. An updated Sherwood plot, shown below, reveals an empirical relationship between the market price of materials and their concentrations using mature separation technologies.

Above: an updated Sherwood plot from Grübler, includes three categories of materials to be refined or separated: metals, organics, and pollutants. The Sherwood plot shows the relationship between the concentration of a target material in a feed stream and the cost of removing the target material. Notice that concentration decreases to the right on the x-axis. The heinous toxic CO₂ gas, directly from a coal-fired power plant exhaust stack, is shown left and at the bottom. On this plot this is 0.1 mole fraction of CO₂ or about about 12%, much much more concentrated than CO₂ in the air, which is 0.04 %.

Above: energy intensive direct air capture (DAC) fans suck in air that contains dilute 400 ppm CO₂. After capture by an absorbent, CO₂ is released from the absorbent by heating, followed by isolation, storage, maintenance, and possibly injection of the captured CO₂ into the earth.
The Huge Energy Costs to Extricate CO₂ from Air
Aatish Bhatia has conveniently calculated and plotted the theoretical versus real world energy costs of DAC in his Substack, which are reproduced below, and further illustrate Sherwood’s concept.

Above: the graph shows the theoretical minimum energy needed to extract 1 tonne metric of CO₂ from the air, plotted versus the fraction of CO₂ in the air. Dilute CO₂ is much harder to remove than more concentrated CO₂, and that is why the plot goes ballistic vertical at low CO₂ concentrations.
Regarding the graph above, lets straighten out it’s exponential curve to make it more easy to visualize, and see where we are with that 400 ppm of CO₂ and the theoretical energy needed for capturing 1 tonne metric of it.

Above: log graph shows crossover point of 400 ppm or 0.0004 CO₂ fraction with energy needed to isolate 1 tonne of CO₂. Dilute CO₂ is very costly to remove from air as shown.
The DAC CO₂ Numbers: Reality is Brutal
We can see from the last graph that the calculated theoretical minimum energy cost to extract 1 tonne of CO₂ from air is approximately 500 Megajoules (MJ) or 140 kWh. These numbers are within most published estimates, and tells us what is theoretically possible, but not what’s technologically feasible.
DAC Reality Check 1: Any real-world DAC process has significant energy losses or inefficiencies which cause it to consume more energy than the 140 kWh. More realistic estimates suggest that the best we can achieve is 10 times the theoretical estimate (aka 10% thermodynamic efficiency) = 5000 Megajoules (MJ) or 1400 kWh to remove 1 tonne of CO₂ at 10 % thermodynamic efficiency.
DAC Reality Check 2: In 2020, the world used 462 exajoules (EJ) of energy from fossil fuels, which resulted in 32 billion tonnes of CO2 emissions. Capturing that carbon dioxide through DAC — which sucks the greenhouse gas out of the air — would require 448EJ, according to calculations by Australian math-as-a-service company Keynumbers.
DAC Reality Check 3: That 448EJ is the equivalent of 124,444TWh — more than five times the annual global electricity consumption in 2020 (23,177TWh, according to Enerdata). And that doesn’t even include the energy that would be required to then transport and store the captured CO2.
Above is a pdf that goes into detail about the inefficiencies of DAC.
Conclusions
We have proposed that other planetary forces and phenomena, such as albedo, play a much larger role than CO2 in global warming or temperature variations.
The basic laws of physics and thermodynamics are not in support of efficient processing of CO2 using DAC. This is because dilute molecules of CO2 in air prefer to randomly mix and achieve maximum disorder or entropy per The Second Law of Thermodynamics.
Per Sherwood, trace amounts of CO2 molecules in an air mixture are difficult and costly to separate.
Capturing CO2 by DAC takes at least as much energy as that is contained in the fossil fuels that produced the carbon dioxide in the first place, per Keynumbers.
Albedo and Sun Dominates Warming vs. CO₂ Tasty Tidbits
Hope is Eternal Bonus Section

Above: cargo cult waiting for the supply plane to come back again and drop off goods.
Nobel Prize Winning Physicist Feynman’s Famous “Cargo Cult Science” Speech
Extra Thoughts: What Might Happen if CO₂ is Removed from the Air ?
If CO₂ is removed from the air in some significant quantity, CO₂ may outgas from the other sinks (land, oceans, lakes) to replace the removed CO₂. The reverse is true as well: when CO₂ is increased in the air, land/oceans/lakes) will uptake more CO₂ until a new quasi-equilibrium state is possibly reached over time.
A recent Nature Climate Change paper discusses the possible effect of CO₂ removal on the global carbon cycle. The paper notes that removing tons of carbon dioxide from the atmosphere might not be effective, because the shifting atmospheric chemistry could, in turn, affect how readily land and oceans release their CO₂, aka Le Chatelier’s principle. Another reference discusses the same concepts, and it is noted that both rely on synthetic models, like most climate change theory.
Handwaving synthetic climate models: a general rule that has been propagated is that for every tonne that ends up being emitted from fossil fuels or “land use changes”, a quarter gets absorbed by trees, another quarter by the ocean and the remaining half gets left in the atmosphere. I have not seen any hard data that backs this up. It basically says half the CO₂ emitted by man is left over and can’t be absorbed or re-equilibrated.
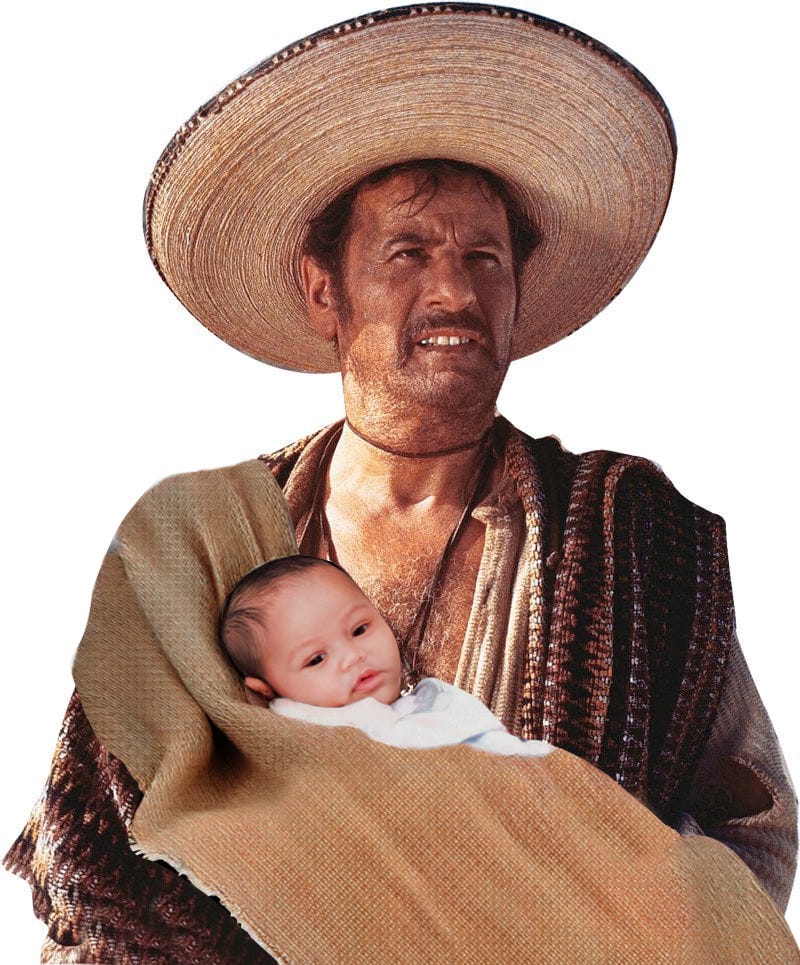
Tuco and his Child thank you. All free all the time.