


Ice Core Zoom In and CO₂ Self Control
A return to basics and CO₂ saturation


Above: Drill Baby Drill
Tuco’s Child Preface
To quote Nobel Prize Winning Richard Feynman:

Taking Feynman’s wisdom into account, and to keep my bearings, I tend to pay attention to the more conservative scientists who made their careers and reputations prior to the EPA Endangerment Finding, which declared that CO2 is a dangerous pollutant.
CO₂ is the only “pollutant” that I know of that is required for life on Earth.
In a similiar vein, here we will examine ice core data from the Antarctica and Greenland to see if there are any temperature changes that can be attributed to the more recent CO₂ increase in the atmosphere.
This article will also touch upon the concept of CO₂ saturation, wherein the warming effect of CO₂ is limited to lower concentrations of the gas, and where the doubling or more of the CO₂ concentration makes little difference.

Above: slicing off a piece.
Zoom-Out: 800,000 Years of Antarctica Ice Core Data
"No single temperature record from anywhere can prove or disprove global warming, because the temperature is a local record, and one site is not the whole world," R.B. Alley.

Above: 800,000 years of ice core data as presented by British Antarctic Survey. Note the ADDITION of recent atmospheric CO₂ data, not taken from the ice core data, by the British Antarctic Survey.
The above plot from the British Antarctic Survey is one representation of the change in temperature and CO₂ levels derived from the oldest continuous ice core as drilled by the European Project for Ice Coring in Antarctica (EPICA), from Dome C on the Antarctic plateau.
The 800,000 years of ice core data shows a succession of long, cold ‘glacial’ periods, followed by 100,000 years by warm ‘interglacial’ periods. The last 11,000 years is the most recent data. CO₂ levels align with the warming periods, as CO₂ concentration in water or in soil is inversely proportional to temperature, and more CO₂ will outgass into the atmosphere when warmed.
Per the normal practice, these ice core data was collected by analyzing oxygen isotope ratios and ancient CO₂ levels derived from trapped air bubbles.
In the above figure please note again the addition of atmospheric CO₂ data by the British Antarctic Survey showing a large spike in CO₂ concentration from “human-made” emissions. Not seen is any concomitant spike in warming or delta C.
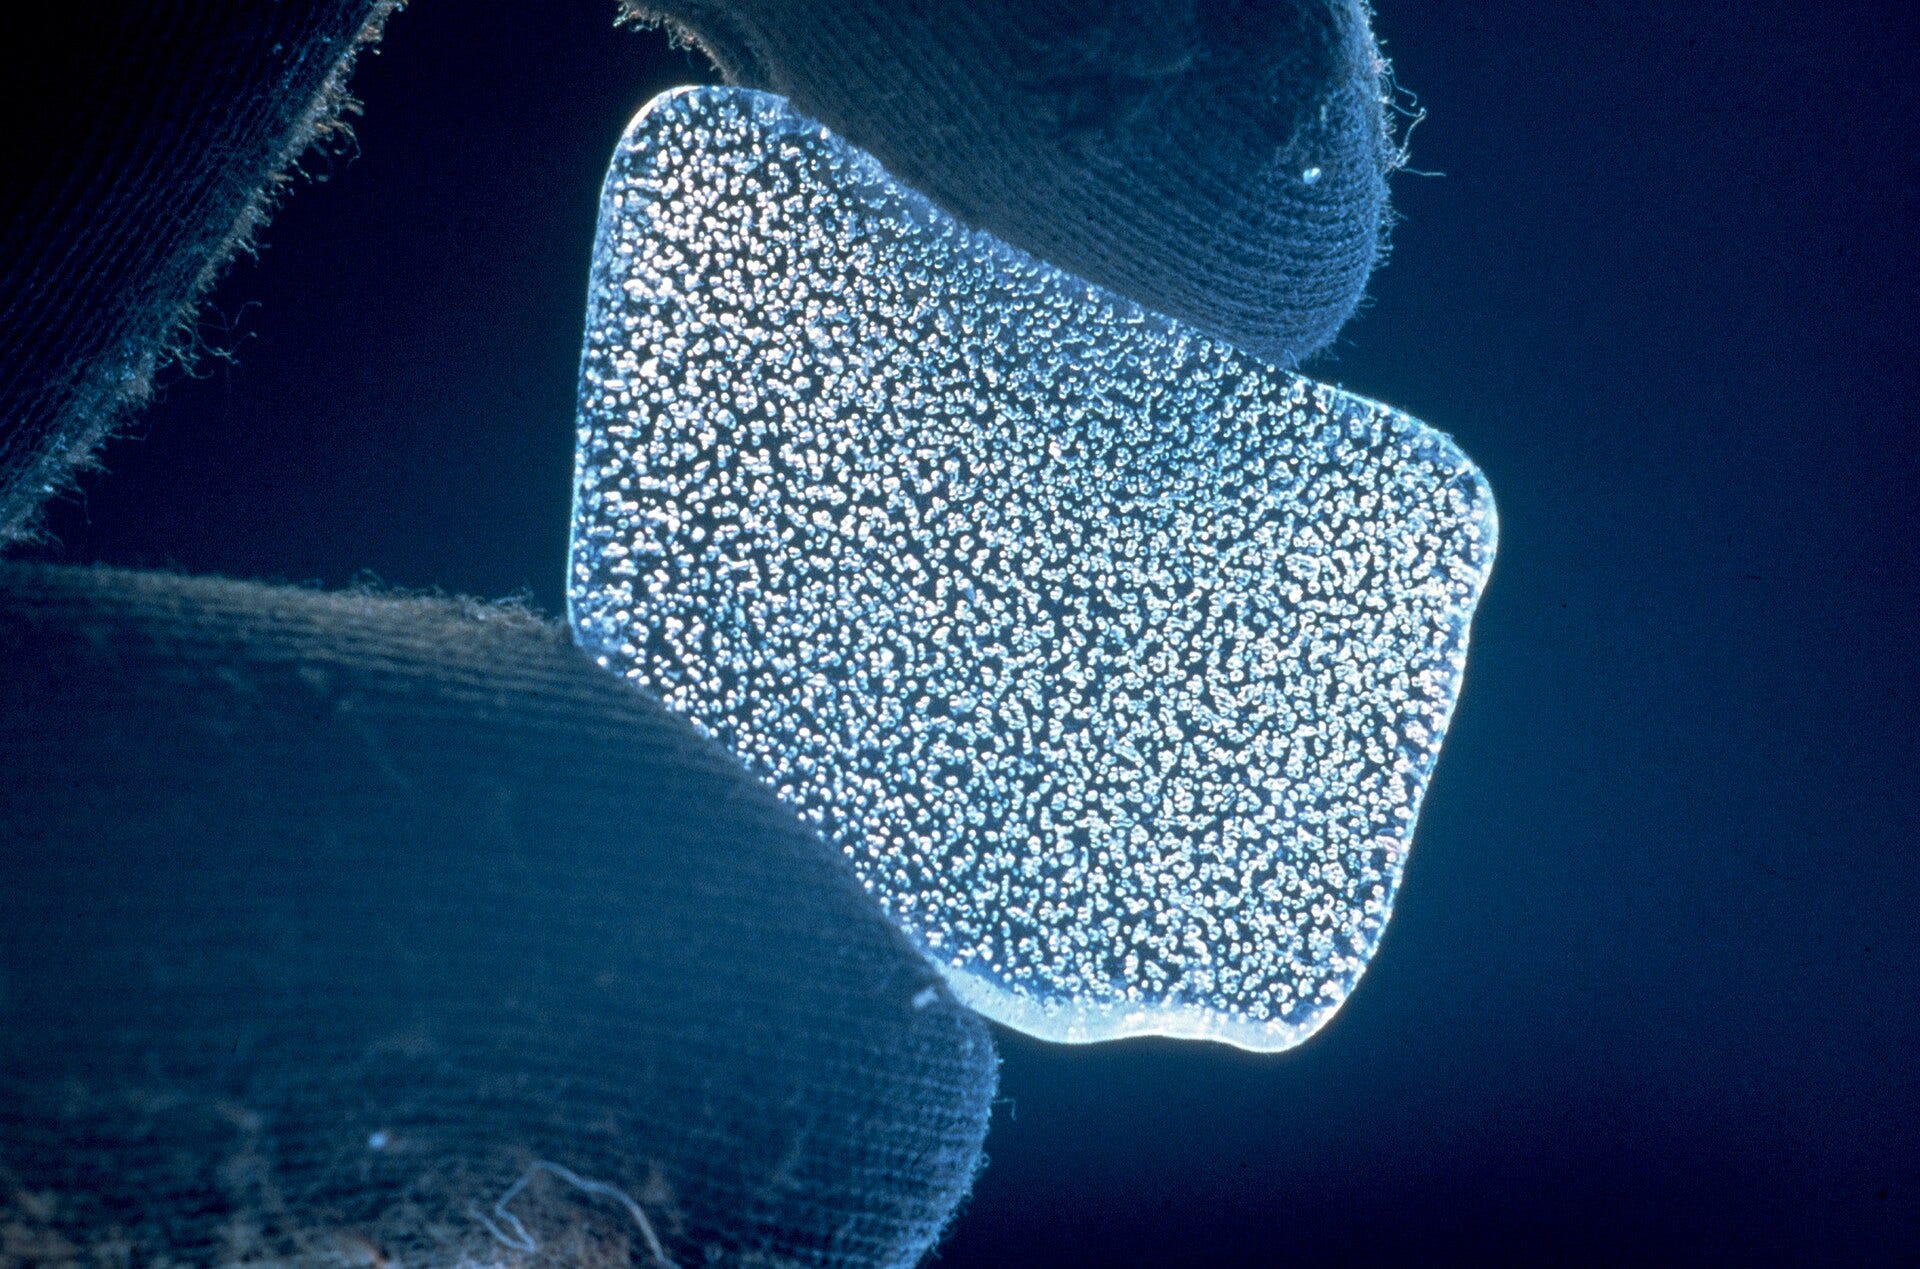
Image above shows a piece of ancient ice with ancient trapped air bubbles. The concentration of CO2 may be calculated at the age of the trapped air.
For arguments sake, let us accept that the industrial age has caused an increase of CO₂. But what is the effect on global temperatures per ice core data? Examining the above 800,000 years of Antarctica data, no spike or increase in warming is apparent. Let's now zoom in 2x and see if we can detect any temperature changes.
2x Zoom-in on the Antarctica Plot: 450,000 Years
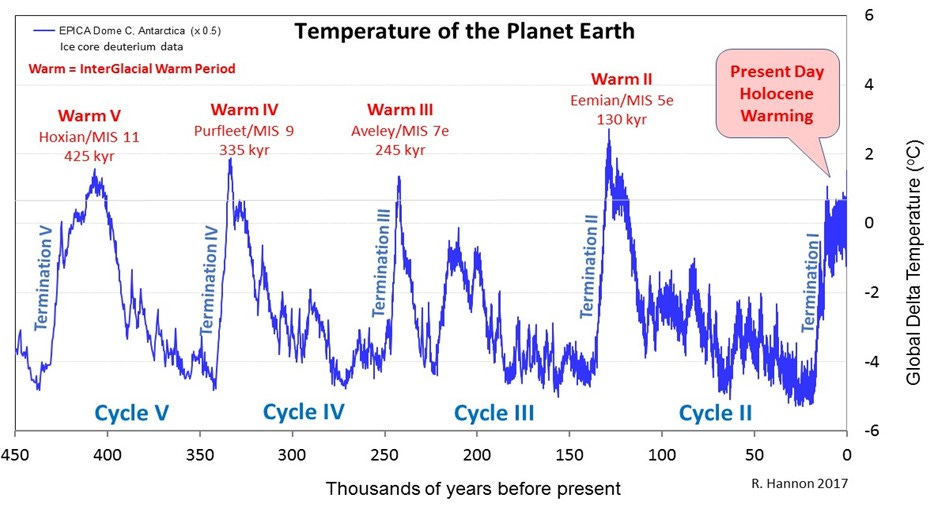
Above: zoom-in on Antarctica EPICA Dome C plot from deuterium isotope data (2H or deuterium from water). Shown are the past 450 K years with four warm periods prior to the present-day Holocene warming. No increase in the magnitude of the temperature is apparent due to increasing human-made CO₂. Because are exiting a Little Ice Age, it is difficult to decouple and study the effects of increased atmospheric CO₂ (420 ppm) on warming if it exists. Calculated temperatures from the Antarctica Dome C data are multiplied by 0.5 to correct to approximate global temperatures rather than polar temperatures.
Moving 17,407 km North to Greenland: 10,000 Years of Data

Above: Zooming in on the last 10,000 years or so - NOAA data from GISP2 of Greenland shows normal earth heating and cooling cycles, as denoted by the numbers 1-10. We are exiting the Little Ice Age and thus warming. This makes it difficult to decouple and study the effects of atmospheric CO₂ (420 ppm) on warming if it exists. No increase in the magnitude of the temperature is apparent due to increasing human-made CO₂ is observed.
The above graph was shared by the CO2 Coalition, an organization founded by scientists and supported by scientists. However, CO2 climate change proponents go apoplectic when the name is mentioned, and the organization is labeled as a bunch of “climate change deniers” supported by the oil and gas industry.
I note that the foundation was formed in the year 2015, but many of the scientists and papers referenced are from the pre-climate hysteria days and are Old School common sense scientists that do not necessarily have an axe to grind, and have had satisfying careers. Eminent no-nonsense and easy to understand scientists at the Coalition include Nobel Prize winning physicist John Clauser, William Happer, and Mark Mills.
Greenland Ice Core Data: Zooming in 2.5 x or 4,000 Years

Above: Zooming 2.5x or about 4,000 years - NOAA data from GISP2 shows normal earth heating and cooling cycles based on oxygen isotope data. We are exiting the Little Ice Age and thus warming. This makes it difficult to decouple and study the effects of atmospheric CO₂ (420 ppm) on warming if it exists. No increase in the magnitude of the temperature is apparent due to increasing human-made CO₂.
CO₂ Has Self Control 1: the Self-limiting Greenhouse Effect
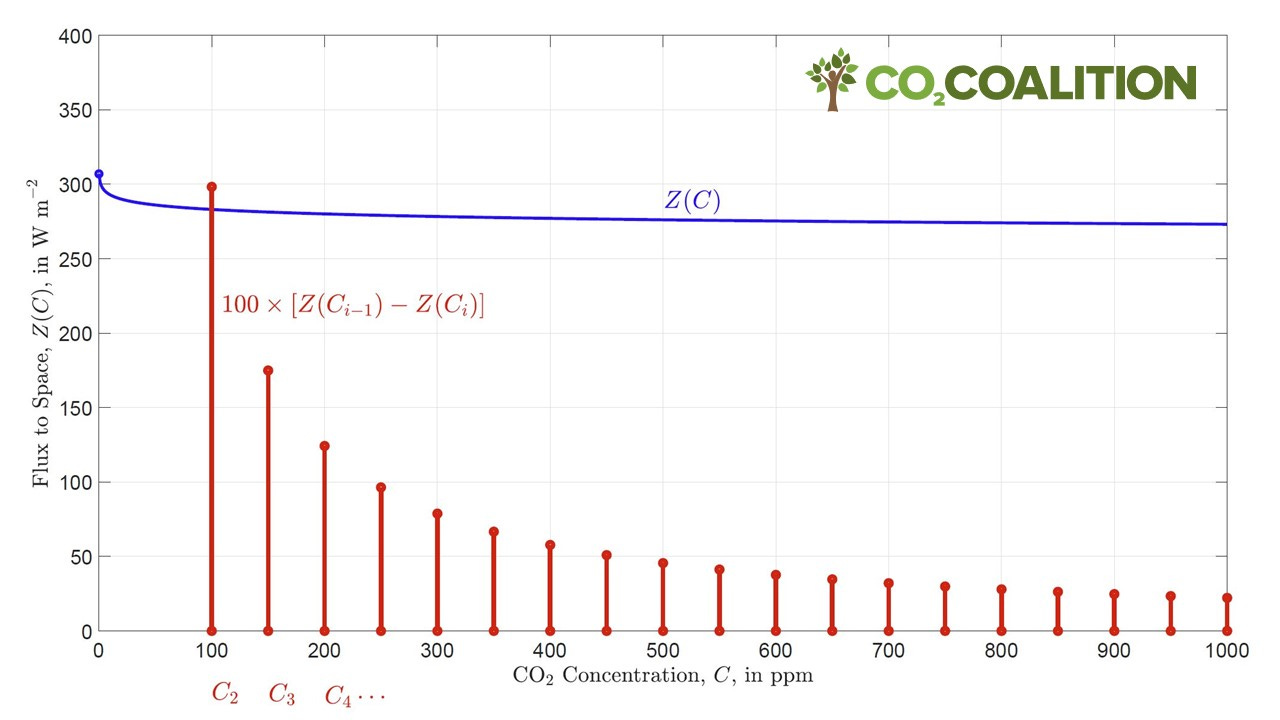
Above: Increasing human-made CO₂ concentrations don’t necessarily cause warming. As shown above, 100 ppm of CO₂ has the greatest heat trapping effect, but as CO₂ concentration increases to 400 ppm, the effect decreases logarithmically. This phenomenon is also known as “CO2 saturation”, wherein additional CO2 has less and less heat trapping effect. Reference: Dependence of Earth's Thermal Radiation on Five Most Abundant Greenhouse Gases.

Believe it or not! In agreement with the graph above from the CO2 Coalition, a group of scientists at UC Berkeley and Harvard published: Why the Forcing from Carbon Dioxide Scales as the Logarithm of Its Concentration. Yes, they are in agreement, and if you want to dig, there are many cited and citing references.
CO₂ Has Self Control 2: the Self-limiting Greenhouse Effect

Above: Atmospheric carbon dioxide saturation versus temperature increase, based on data from Lindzen and Choi, 2009. As shown above, 20 ppm of CO₂ has the greatest heat trapping effect, but as CO₂ concentration increases to 400 ppm, the effect decreases logarithmically. This phenomenon is also known as “CO2 saturation”, wherein additional CO2 has less and less heat trapping effect. Source.
And a Word from Will
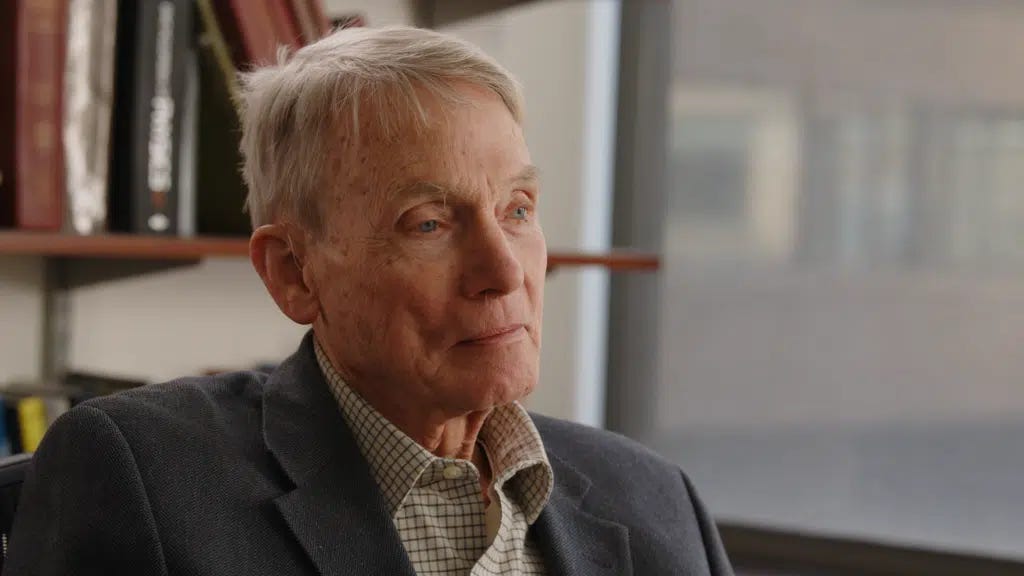
Dr. Will Happer, “The message I want you to understand, which practically no one really understands, is that doubling CO2 makes almost no difference. You could triple or quadruple CO2 concentrations, and it also would make little difference.”
Conclusions
Published ice core data suggests that we are exiting a Little Ice Age and thus warming. This makes it difficult to decouple any real effects of increasing atmospheric CO₂ (now 420 ppm) on global warming.
As atmospheric CO₂ concentration increases, the warming effect decreases logarithmically. This phenomenon is also known as “CO₂ saturation”. Finally, CO₂ concentration in water or in soils is inversely proportional to temperature. This means that when warmed, more CO₂ will outgass from water and soils into the atmosphere .

Thank you. The real experts are writing on Substack imo.
Nice summary.
S. Ichtiaque Rasool and the late Stephen Schneider (back when he was an acolyte in the "coming ice age" cult) wrote in "Atmospheric carbon dioxide and aerosols: Effects of large increases on global climate," Science, 173(3992):138–141, July 9 1971, that the CO2 "doubling sensitivity" of the atmosphere is 0.76°C. They concluded that no matter how much coal we burn, we cannot stop the coming ice age. Schneider later became the High Priest of the Global Warming cult. In an interview with Detroit News he admitted "Each of us has to decide what the right balance is between being effective and being honest."
Ice cores are actually reasonable proxies for average hemispheric temperatures because most of the water in them was evaporated from the oceans and then carried to the poles by Hadley-cell circulation.
In GISP2 data, 1880 was the coldest year in 8,700 years. It was also about the same time that systematic temperature measurements began being recorded — in the northern hemisphere. They were only recorded at one place in the southern hemisphere — Jakarta. If you start measuring at the minimum, all you can see is increase.
Here's another Feynman quote to add to your collection "No matter how beautiful your theory, if it doesn't agree with reality it's wrong." Unlike Yogi Berra, Feynman never said "I didn't say half the things I said."
Details in my book "Where Will We Get Our Energy?" Everything quantified. No vague handwaving. 350 bibliographic citations allow readers to verify I didn't simply make up stuff.