


Update: CO₂ from 2025 California Fires Equates to Burning 450 Million Gallons of Gasoline
4 million tonnes of CO₂e and counting


Above: discounted celebrity homes tours available.
Tuco’s Child Preface
In review, I recently published a piece that described the erasure of Gavin Newsom’s “climate change” net-zero carbon gains by California wildfires:

The article disclosed some astonishing numbers in regards to the amount of CO₂e and untold toxics given off by the 2020 fires: 127 million metric tonnes of CO₂e.
I was curious as to the energy equivalents in terms of the 127 million, so I plugged into the EPA handy-dandy Greenhouse Gas Equivalencies Calculator that “converts”, may I quote:
Converts emissions or energy data into concrete terms you can understand — such as the annual CO2 emissions of cars, households, and power plants.
I was flabbergasted to learn what the 2020 CA fires 127 million metric tonnes of CO₂e converts to, per sampling below:
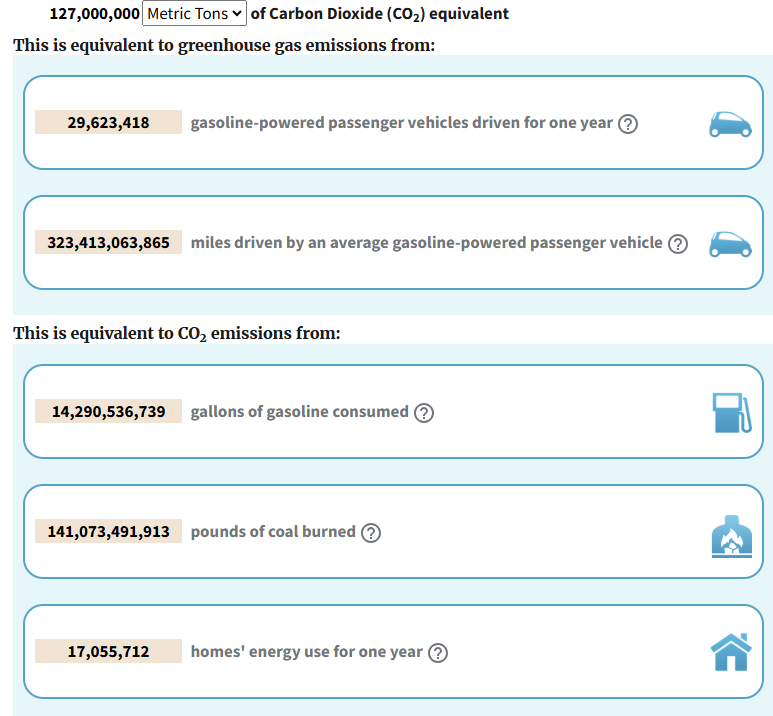
Above: Wow, 127 million metric tonnes of CO₂e converts to 14 billion gallons of gasoline consumed or 17 million homes entire energy needs in one year!
The Latest CO₂e Estimates for the January 2025 California Fires
As of 01-30-25 CALFIRE reports that the major fires are 97 % + contained. The CALFIRE statistics:
48,336 Total Emergency Responses
319 Wildfires
57,635 Acres Burned
29 Fatalities
16,255 Structures Destroyed
Just prior to this report, a scientist estimated that the CA January 2025 fires have released almost 4 million metric tonnes of CO₂e and counting, the most CO₂ blown off in 20 years or so for a January. This number is incomplete, as it was an early estimate, and the Moss Landing Battery Storage Fire CO₂e was not included.

Above: Lest we forget, the Jan. 2025 Moss Landing power plant lithium battery fire has also spewed untold amounts of toxins and caused evacuations.
Four million metric tonnes of CO₂e and counting is alot of bad gas for just January. According to the EPA Greenhouse Gas Equivalencies Calculator, 4 million metric tonnes of CO₂e equates to 450 million gallons of gasoline.
What follows below is a sampling of the equivalencies derived from the initial estimate of 2025 January fires 4 million metric tonnes CO₂e from the EPA Greenhouse Gas Equivalencies Calculator.

Above: EPA Greenhouse Gas Equivalencies Calculator output for 4 mmt CO₂e yields 450 billion gallons of gasoline and other comparisons.
Source Article for the Initial Estimate of the CA January 2025 Wildfires CO₂e
Scale of LA fires is unusual compared to emissions from California fires for January over the last 20 years: Mark Parrington
Senior scientist at the Copernicus Atmosphere Monitoring Service speaks to Down To Earth on carbon dioxide emissions from the recent wildfires in LA, global trends in fire emissions and air quality impacts.
By Rohini Krishnamurthy - Down to Earth Published on: 27 Jan 2025, 5:17 am
Both the Palisades and Eaton fires broke out on January 7, 2025 in Los Angeles, United States. According to data from the California Department of Forestry and Fire Protection, 70 per cent and 95 per cent of the fires in Palisades and Eaton had been contained as of January 23, burning more than 23,000 and 14,000 acres of land, respectively.
A second set of fires — Hughes fire, Sepulveda fire and Clay fire — began on January 22, 21 and 23, respectively. These have burned over 10,000, 40 and 39 acres, respectively. As of January 23, only 14 per cent, 0 per cent and 65 per cent of the Hughes, Sepulveda and Clay fires have been contained. Preliminary estimates suggested there have been 28 fatalities, with more than 15,000 structures destroyed.
Down to Earth spoke with Mark Parrington, a senior scientist in the Copernicus Atmosphere Monitoring Service (CAMS) Development Section at the European Centre for Medium-Range Weather Forecasts, on carbon dioxide (CO₂) emissions from the fires, global trends in fire emissions and air quality impacts.

Mark Parrington is a Senior Scientist in the Copernicus Atmosphere Monitoring Service Development Section at the European Centre for Medium-Range Weather Forecasts
Rohini Krishnamurthy (RK): How significant are the LA wildfires in terms of emissions?
Mark Parrington (MP): The emissions from California were estimated at 1 megatonne of carbon (3.67 million tonnes of CO₂ equivalent) for January. Compared to emissions from California fires for January over the last 10 years, January 2025 is already considerably higher than what is typically expected for this time of year.
 was emitted from fires in the first 15 days of the year. This is equivalent to roughly half of what California’s forests sequester in a year (7.39 million tonnes of CO₂e annually). For the first time in two decades, January fire emissions in California have exceeded 1.5 million tonnes of CO₂e")
1 megatonne of carbon (3.67 million tonnes of CO₂e) was emitted from fires in the first 15 days of the year. This is equivalent to roughly half of what California’s forests sequester in a year (7.39 million tonnes of CO₂e annually). For the first time in two decades, January fire emissions in California have exceeded 1.5 million tonnes of CO₂e
The wildfires in California are significant not only for their emissions but also for the devastation and air quality impacts, which are the two main concerns. The emissions, however, are not as significant as those that occur in wildfires in Canada or, South America. We could see relative to those previous 20 years, where the current situation stands.
California experienced comparable emissions in December 2017. The emissions are influenced by environmental and meteorological conditions.
RK: Are wildfires usual at this time of year?
MP: The Santa Ana winds are fairly typical at this time of year. These winds, combined with dry vegetation and soil, are the main contributing factors. However, fires of this scale in January are unusual, based on the over two decades of data that we have. Particularly, the damage caused in one of the world’s most famous cities is unprecedented.
RK: Are wildfire CO₂ emissions globally emerging as significant contributors?
MP: Over the last 10-15 years, we’ve observed a gradual shift in forests, which were once considered carbon sinks, becoming net emitters.
We are not running carbon cycle models. So, we are unable to examine how forests are becoming overall net emitters, how much carbon is emitted by fires, how much of that remains in the atmosphere and how much of that is absorbed. But we do have data on instantaneous emissions. With datasets from the past two decades, we can observe, almost in real time, how the situation in different parts of the world is changing relative to historical trends.
RK: What global emission trends have you observed?
MP: Over the last 20 years, there has been a downward trend in burned areas and fire emissions globally, primarily due to changes in land use. However, if we only look at tropical Africa emissions, we can see that the downward trend continues. An exception to this trend was 2015, an El Niño year, when large fires in Indonesia burned for several weeks. Following that, the downward trend resumed.
However, in the last two years, we’ve observed an upward deviation. In 2023, Canada experienced large-scale wildfires from May through September. In 2024, while the fires in North America, particularly Canada, were not as prolonged, they were still significant from June to August. Additionally, South America, including the Amazon, Panama and Bolivia, experienced severe wildfires. These events explain the recent increase in global fire emissions.
This year, we will have to wait and see if something similar happens in Canada or South America. It is far too early to say what we might see in 2025.
")
Global fire emissions in 2023 and 2024 were approximately 2,170 and 1,940 megatonnes of carbon, respectively. This corresponds to 7,960 million tonnes of CO₂e in 2023 and 7,115 million tonnes of CO₂e in 2024 — roughly half of the 15,600 million tonnes of CO₂ sequestered annually by global forests (as per NASA)
RK: What are the gaps in estimating wildfires in urban settings like LA?
MP: When estimating emissions, we assume the presence of vegetation but do not account for differences in the wildland-urban interface (the zone of transition between unoccupied land and human development). With our data, all we can say is that the estimates are based on an assumption of a specific type of vegetation, consistent with data from the past 23 years.
There is ongoing research into the wildland-urban interface, particularly in California, where population expansion into areas with a history of wildfires has posed challenges. Understanding the emission profiles of burning houses, vehicles and other human-made items — each with distinct emission characteristics — is still a work in progress. This variation is not currently accounted for in our system, as it likely differs by country and continent.
We are also somewhat limited by relying on assumptions about vegetation types. However, the wildfire science community is developing higher-resolution datasets and working to better understand emission factors. These factors help convert the known amount of vegetation burned into the associated air pollutants, carbon gases and other emissions. So, estimates will improve and become more accurate in the coming years.
RK: What do we understand of emission of pollutants?
MP: CO₂ emissions from wildfires are complex because some of the carbon is reabsorbed over time and does not remain in the atmosphere. However, many other pollutants are not reabsorbed by the biosphere and can impact air and water quality.
Studies over the years have identified particulate matter, heavy metals and persistent organic pollutants as by-products of burning vegetation. While their presence in the atmosphere is bad enough, their infiltration into water supplies poses a much greater risk
The initial focus was on evacuation and protecting people in LA. Later, I noticed discussions on social media about air quality and the news media also reported on its impacts.
I think that our understanding of the effects of wildfire smoke on human health is still evolving. I expect to see more research into the health effects of these fires on LA residents.
It appears that much of the smoke is being blown out to the ocean due to strong winds, preventing the pollutants from accumulating locally as they did in parts of Canada in 2023 and 2024, or South America in 2024.
In Los Angeles, concentrations of fine particulate matter (PM 2.5) have exceeded 200 microgrammes per cubic metre. However, the winds are providing some ventilation, blowing the smoke away. If the winds were to die down, the smoke would accumulate, leading to severe air quality issues.
We are analysing the PM 2.5 and other pollutants at the moment. We are seeing enhancements in PM2.5, aerosol depth, carbon monoxide and other smoke constituents. However, because our model has a spatial resolution of about 40 kilometres, it may be a little on the coarse side. It may take some time to obtain a complete picture.
It seems that much of the smoke remains lower in the atmosphere while being transported out to sea. This makes it challenging to analyse with our current resolution, but other air quality modellers may use higher-resolution models in the future.
RK: What are the impacts of smoke moving to the ocean?
MP: I don’t think there would be too many complications. The smoke transport lasts only a few days. In the past, studies have linked such events to impacts like ocean fertilisation, such as the Australian fires of 2019-2020. Papers on that event observed phytoplankton blooms in the Southern Ocean caused by smoke transport.
With LA, there may be some deposition into the ocean, but we do not have reliable data on this. We can try to estimate it because the scale is too small to get a clear picture.
RK: Wildfires were included for the first time in the United Nations Emissions Gap report in 2023. What are your thoughts on this, given that human-caused climate change is fuelling wildfires?
MP: Yes, for the first time, wildfire emissions, such as those in South America, have been considered in the emissions gap and global carbon budgets. However, these emissions are still categorised within the land-use change sector and remain a relatively small component of it.
In terms of annual CO₂ emissions, fossil fuel combustion and power generation remain by far the largest contributors.
The key question is whether climate change is altering the behaviour of the carbon cycle. If it affects the ability of vegetation to reabsorb CO₂, this could significantly influence how much carbon remains in the atmosphere.
The San Francisco Chronicle (in 2023) themselves said that ONE - just ONE - major forest fire in California COMPLETELY erases any and all efforts of the state to curb emissions from the previous few years. They have, on average 3 to 4 a year.
The story that needs to also be told is the effects of the Hunga Tonga-Hunga Ha'apai volcano eruption of 2022. It was SO huge that Nasa scientists posted/ published/printed/ said it would affect the Earths weather FOR YEARS.
And then the entire story DISAPPEARED. Including from NOAA's year end warp up report!
Its like the biggest expulsion of ash into the stratosphere EVER in the known history of the PLANET.
According to the libs my 2002 diesel truck produces more carbon just getting to the gun store...